
NetSuite’s standard reporting works – until you need consistency, multi-entity views or clean outputs for the board. That’s where these 13 NetSuite reporting tools make all the difference. Check out their core features, key benefits and where each tool fits best.
What is a NetSuite reporting tool?
A NetSuite reporting tool is any solution that helps you extract, analyze or visualize data from your NetSuite ERP environment. Examples include:
- Built-in tools like saved searches and SuiteAnalytics
- Native SuiteApps like ZoneReporting
- Third-party business intelligence (BI) platforms that integrate with NetSuite via API or data warehouse
The best reporting tools for NetSuite show the numbers that matter – booked revenue, project margins, cash position – and make them traceable and tied directly to the source. This level of accuracy means fewer exports, cleaner audit trails and faster answers when your exec team asks for trends.
This demand for accuracy and speed in NetSuite reporting is a key driver behind the wider adoption of ERP platforms. Grand View Research estimates the global market size will reach $123B by 2030 – growing at a CAGR of 11.7% from 2025 to 2030. This expansion reflects increasing pressure to automate processes and make data-backed decisions across finance, sales, supply chain and other functions.
Keeping up with the speed of business means NetSuite reporting tools must deliver real-time, accurate insights – without depending on delayed refreshes or manual reconciliations.
Top 13 reporting tools for NetSuite – and why they stand out
This review of the best reporting tools for NetSuite isn’t just based on G2 ratings or feature lists. It’s grounded in what ERP teams, especially finance, actually use as complexity grows. We’ll break down both native NetSuite and third-party solutions, with a clear view of their strengths and limitations.
1. ZoneReporting
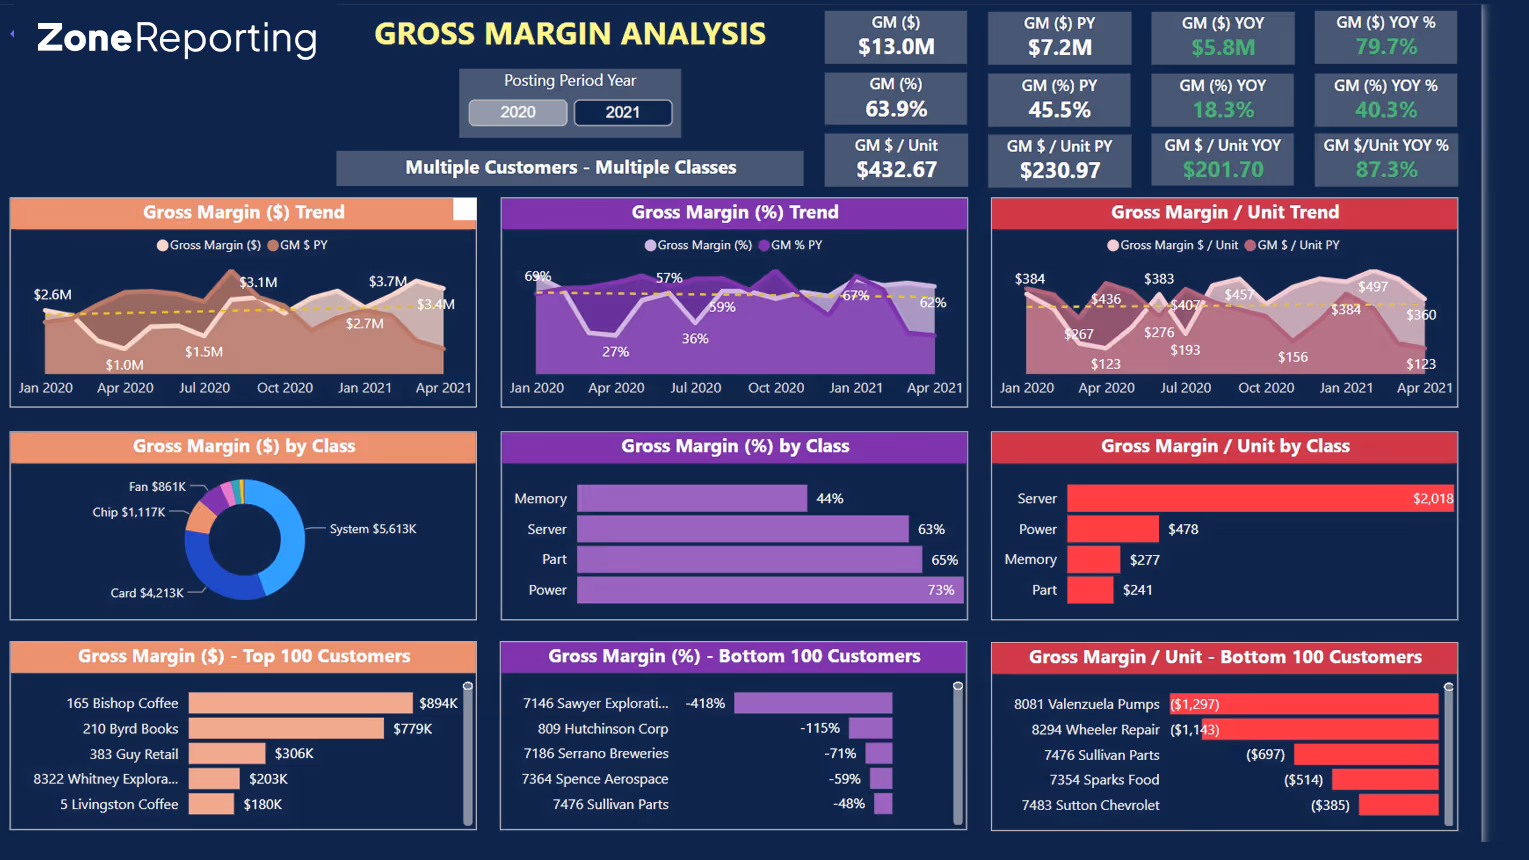
ZoneReporting is a NetSuite-native SuiteApp built to deliver robust financial and operational reporting right inside your ERP. It’s the only pre-built Power BI reporting solution for NetSuite, which means you get enterprise-grade dashboards with direct access to NetSuite data – without building a data warehouse or custom integrations.
Because it’s built on Microsoft Power BI, ZoneReporting also gives you access to native AI capabilities, letting you ask questions and get instant insights without complex filters.
Benefits of ZoneReporting: It's the best reporting tool for NetSuite, keeping analysis where your data already lives. Implementation is fast and guided, so you see value quickly. Finance teams can drill into transactions and consolidate multi-entity data without writing SQL or leaving the platform.
Standout features and capabilities of ZoneReporting:
- Comprehensive Power BI report creation across NetSuite financials, SaaS metrics, supply chain, project services, CRM and billing – with ability to blend in additional data, such as Salesforce
- Prebuilt report templates tailored to NetSuite data structures, so you don’t waste time building business logic from scratch
- NetSuite-to-Power BI integration, eliminating the need for third-party connectors
- Easy to share with stakeholders, export in any format, or embed directly in NetSuite portlets
- Drill-through from BI reports down to the NetSuite transaction to support variance analysis and investigation
- Multi-entity and multi-currency support with built-in logic for foreign exchange translation and intercompany eliminations
ZoneReporting is for: Finance, FP&A, RevOps, Sales, Marketing and operational teams who need fast, native NetSuite reporting – without relying on external BI tools or custom data pipelines.
Best use cases for ZoneReporting:
- Board and investor reporting packs
- Multi-entity consolidation dashboards
- Real-time ERP reporting for finance, sales or operations
- KPI and metric tracking across departments
- Forecast vs actual and budget vs actual variance analysis
Challenges teams can solve with ZoneReporting:
- Proactively identify revenue opportunities and cost overruns
- Make timely decisions on purchases, finances, and operations without requiring a NetSuite login
- Consolidate reporting across entities and currencies
- Automate financial and business reporting without manual updates
When not to use ZoneReporting: If NetSuite's reporting capabilities already cover your simple reporting needs.
ZoneReporting pricing: Costs vary depending on your scope and modules. Schedule a ZoneReporting demo to get a quote that aligns with your specific needs.
2. Solution 7
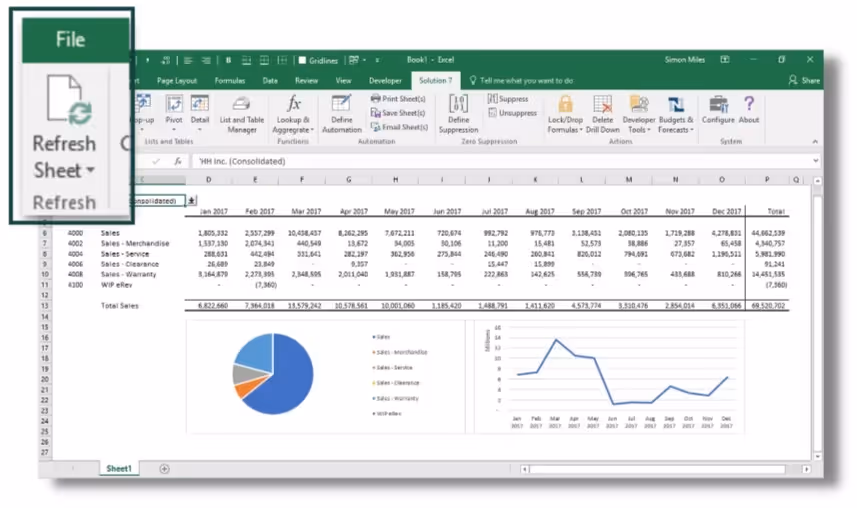
Solution 7 by Zone is a NetSuite SuiteApp designed for finance teams who live in Excel – and are tired of the broken workflows that come with CSV exports and disconnected reporting logic. As a reporting tool for NetSuite and Excel, it gives you real-time access to your NetSuite through an Excel plug-in, so you can quickly build and update reports.
With Solution 7, every number in Excel ties back to the underlying transaction in NetSuite, so your reporting stays accurate, traceable and audit-ready.
Benefits of Solution 7: This NetSuite Excel reporting solution gives your finance teams speed and precision – all within their spreadsheets. It’s quick to implement, with no heavy configuration or steep learning curve required.
Standout features and capabilities of Solution 7:
- Two-way integration between Excel and NetSuite
- One-click refresh to update your report with live NetSuite data
- Drill back to transaction-level detail
- Multi-currency consolidations
- Rapid adoption with minimal training
Solution 7 is for: Companies whose finance teams rely on Excel and want tighter integration with NetSuite. It’s especially useful for businesses managing multi-entity reporting or complex statutory requirements.
Best use cases for Solution 7:
- Consolidated P&Ls and balance sheets across entities
- Budget vs actual reporting with department-level drilldowns
- Variance tracking and rolling forecasts
- Automated board reporting packs with real-time refresh
Challenges teams can solve with Solution 7:
- Reduce time spent exporting and reconciling data
- Avoid errors from disconnected Excel workbooks
- Eliminate dependence on IT or admin support for report building
When not to use Solution 7: If you plan to eliminate Excel entirely from your reporting stack.
Solution 7 pricing: Available upon request. Ask for a demo to see how it works and discuss pricing tailored to your business.
3. Zone Data Warehouse
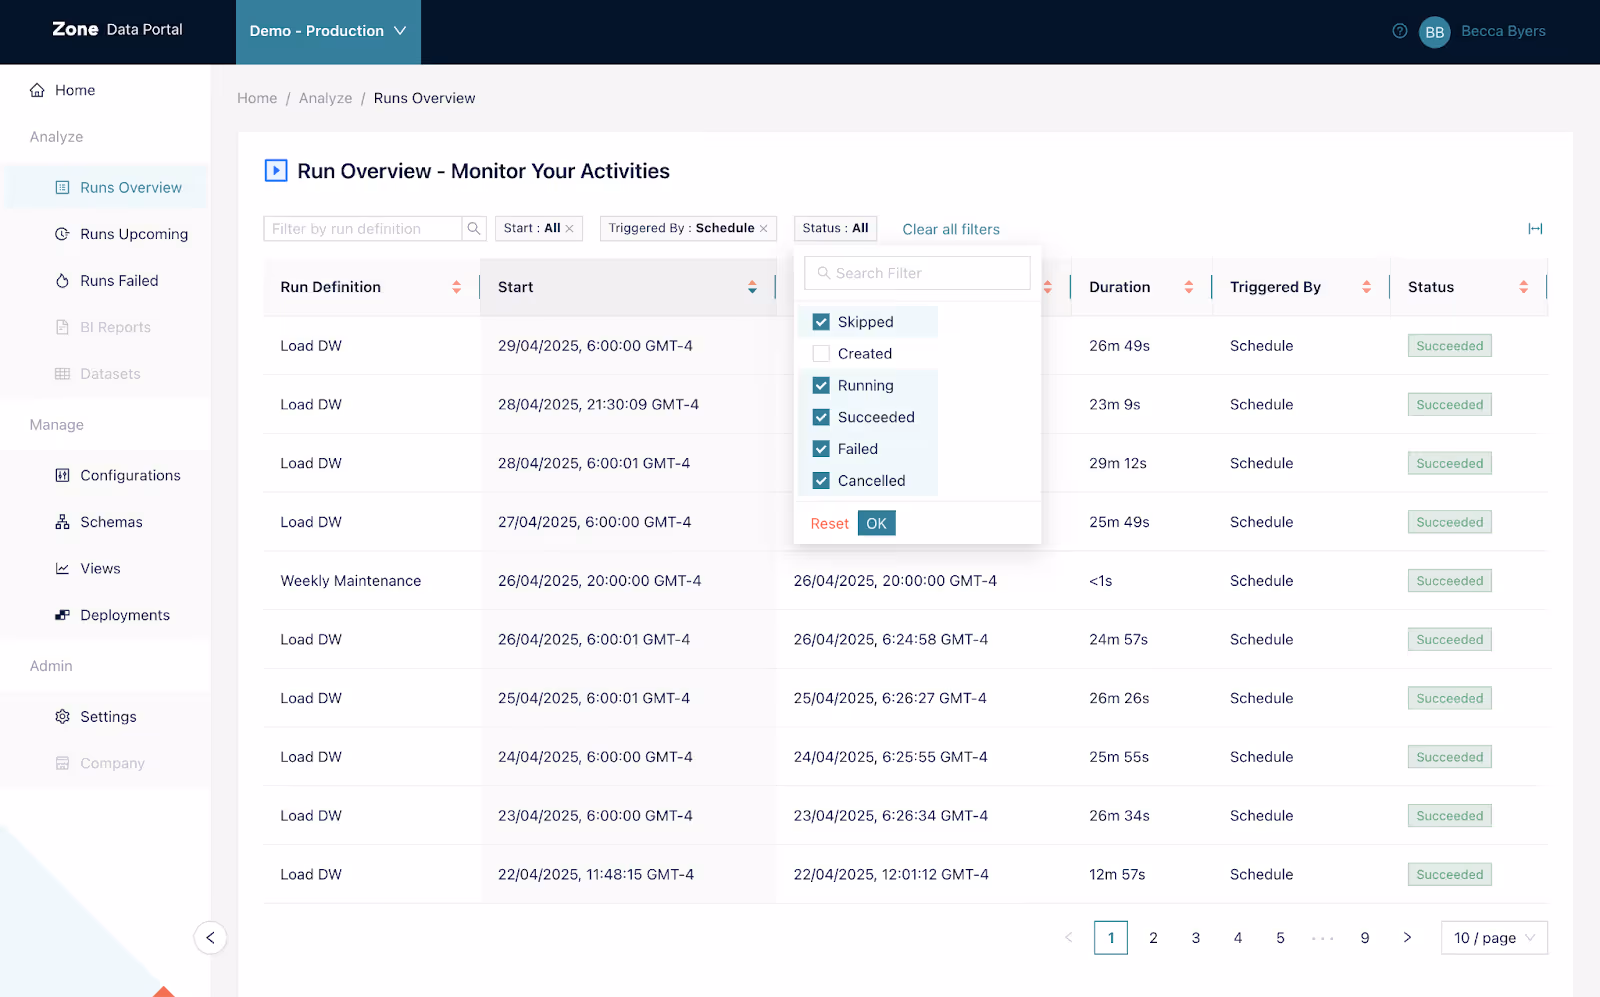
Zone Data Warehouse is a NetSuite-first solution built on Microsoft Azure that extracts, models and delivers ERP data into modern analytics environments. It provides clean, structured NetSuite datasets ready for analysis on platforms such as Snowflake, Power BI, Looker or Tableau.
Compared to generic ETL tools, Zone Data Warehouse comes with prebuilt NetSuite schemas that organize key financial, operational and transactional data. This way, analysts can run advanced reporting right away – no need to map tables or build a data model from scratch.
Benefits of Zone Data Warehouse: Prebuilt models mirror NetSuite’s structure, so you can begin analysis almost immediately. Powerful data management tools also allow you to bring in custom NetSuite fields and records, plus third-party data, with automatic data monitoring and “revert changes” to provide peace of mind.
Zone Data Warehouse also scales easily with high-volume data, making it ideal for enterprise reporting across multiple entities, years and systems.
Standout features and capabilities of Zone Data Warehouse:
- Pre-modeled schemas for NetSuite financial and operational data
- Compatibility with modern BI and DW tools
- Support for large enterprise data footprints
- Out-of-the-box support for custom segments and saved search logic
- Built-in data governance controls to maintain consistency, security and traceability across reporting environments
Zone Data Warehouse is for: Companies with data teams comfortable writing SQL queries and managing data models – including those with growing data volumes. It’s a strong fit for analysts and data engineers who need flexibility.
Best use cases for Zone Data Warehouse:
- Large-scale analytics dashboards for finance, sales and ops
- Multi-entity, multi-source consolidation across ERPs, CRMs and data lakes
- Pipelines feeding NetSuite data into centralized warehouses like Snowflake, Databricks and Redshift
- Multi-source data strategies combining ERP, CRM, operational and web analytics metrics
- Automated reporting for board, audit and compliance workflows
- Near real-time analytics with minimal lag
Challenges teams can solve with Zone Data Warehouse:
- Overcome NetSuite’s limits around single joins and exporting data
- Accelerate analytics for rapid insights into revenue, costs and opportunities
- Blend data sources and view insights in your BI or DW tool of choice
When not to use Zone Data Warehouse: If your business does not have a data team, you may consider ZoneReporting or Solution 7 as better options, since these do not require SQL knowledge.
Zone Data Warehouse pricing: Available upon request and tailored based on data volume.
Keep reading: Look at five signs your NetSuite reporting could benefit from a unified data platform
4. Tactical Connect
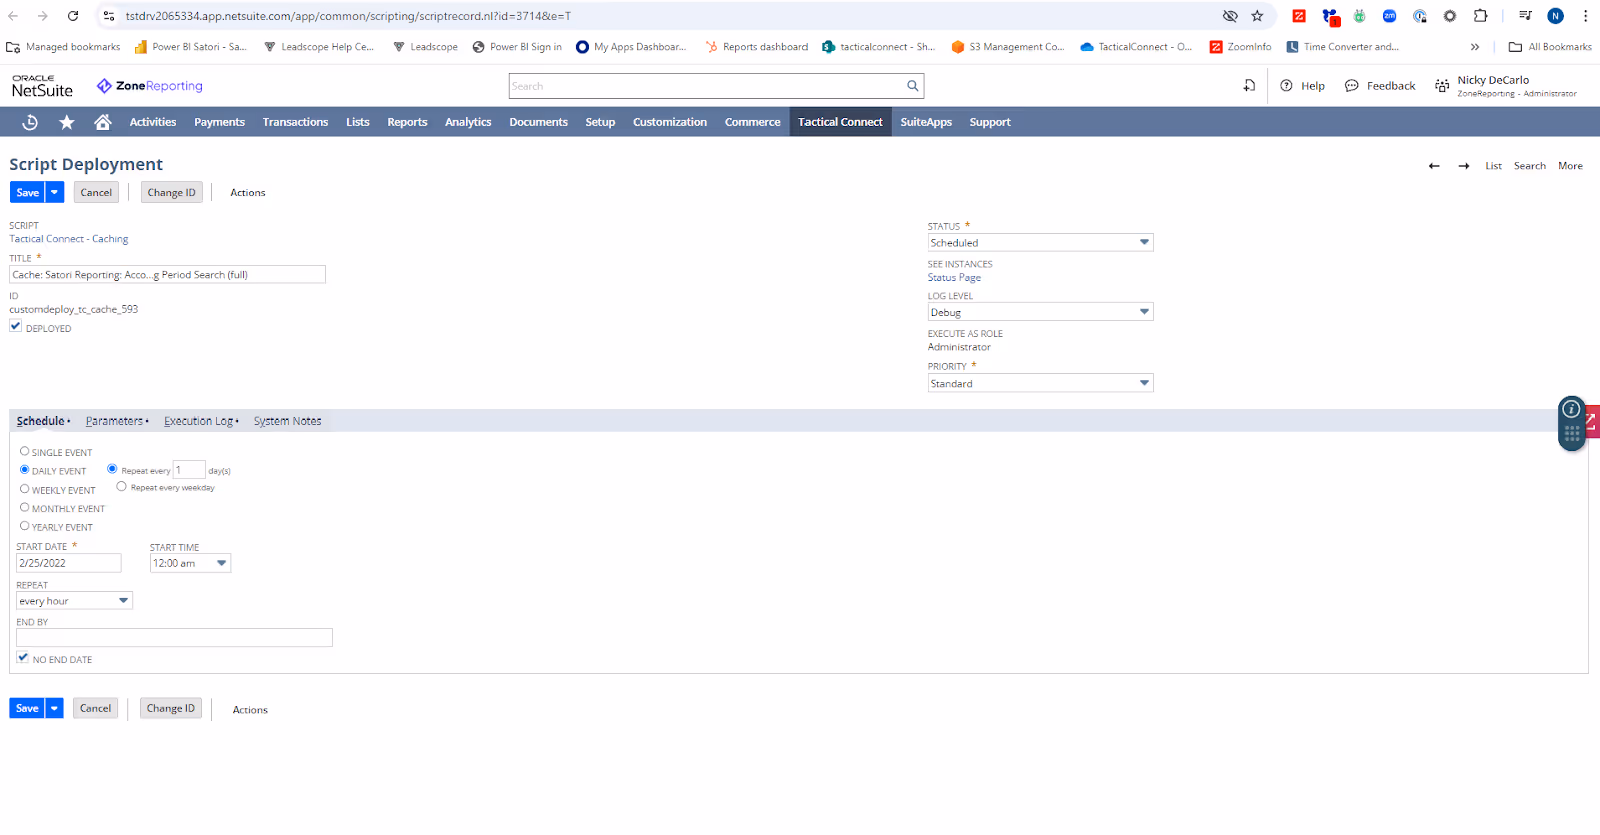
Tactical Connect allows you to access and export any NetSuite Saved Search as a scheduled CSV export. This means any NetSuite data you can access in your account via a saved search, you can now safely extract into cloud storage – such as Amazon S3, SharePoint and more.
Benefits of Tactical Connect: This NetSuite reporting solution gives finance teams a fast, reliable way to export their data for backup, or for additional manipulation to create reports. It can be used as part of an effective disaster recovery plan, or as a baseline for technical teams to create reports in BI or DW tools.
Features and capabilities of Tactical Connect:
- Direct access to NetSuite data via Saved Searches
- Automated exports to your cloud storage
- NetSuite native; no additional tools or technical skills required
Tactical Connect is for: Companies looking for data backup or disaster recovery on their NetSuite data, or for data teams who are comfortable using CSV extracts to build their NetSuite data model from scratch and feed it into BI tools.
Use cases for Tactical Connect:
- NetSuite backup and disaster recovery
- NetSuite extracts that data teams can use in BI reporting
Challenges teams can solve with Tactical Connect:
- Avoid manual data extracts from NetSuite
- Data backup and disaster recovery
- Integrate NetSuite into broader analytics stacks
When not to use Tactical Connect: If your goal is to keep reporting inside NetSuite, a native SuiteApp like ZoneReporting may be a better starting point, as it provides BI reports that can be embedded in NetSuite.
Tactical Connect pricing: Request a demo to see it in action and discuss custom pricing for your needs.
Keep reading: Discover how we bring NetSuite data into Power BI
5. DOMO
DOMO is a third-party BI platform known for its sleek visual dashboards and built-in connectors. It allows teams to pull data from NetSuite and other sources into unified dashboards, making it an option for executive-facing reporting that spans across departments.
DOMO Benefits: This reporting solution empowers non-technical business users to share dashboards without relying on IT or data engineering.
DOMO features and capabilities:
- Native connectors to databases and apps
- Mobile-friendly, executive-ready visuals
- Scheduled updates and automated dashboard distribution
DOMO is for: Companies that need cross-functional dashboards aggregating data from multiple systems.
DOMO use cases:
- Executive scorecards help leadership stay aligned on key metrics
- Sales pipeline tracking offers visibility into deals
Challenges teams can solve with DOMO:
- Unify disconnected data systems
- Create visual narratives for stakeholders
When not to use DOMO: If you need accurate, drillable financial reporting tied to NetSuite’s chart of accounts and subledger detail, you will likely hit limitations. While it offers strong visual storytelling, DOMO is not purpose-built for NetSuite.
DOMO pricing: DOMO lets you pay only for what you use, though some users may find it a higher-cost option compared to other tools.
6. Planful

Planful is a third-party FP&A platform focused on structured budgeting, planning and forecasting. It connects with NetSuite and other data sources to centralize workflows, approvals and controlled models.
Benefits of Planful: Provides structured planning processes to bring discipline to FP&A cycles.
Planful features and capabilities:
- Prebuilt workflows for approvals and version control
- Workforce and expense planning
- Native integration with Excel for input/output flexibility
Planful is for: Finance teams with a dedicated FP&A function that require budgeting and planning controls.
Use cases for Planful:
- Consolidated budgeting cycles
- Multi-scenario forecasting
- Detailed cost modeling
Challenges teams can solve with Planful:
- Break free of budgeting spreadsheets
- Speed up lengthy and cumbersome reforecasting cycles
- Provide visibility for executive decision-making
When not to use Planful: If your focus is on daily operational reporting or traceable financial close reports, other platforms designed for broader analytics or specialized reporting might be a better fit. Planful is not a full NetSuite reporting tool. Reporting is embedded in the planning cycle – not something teams use for daily decision-making.
Planful pricing: Not publicly listed. Contact sales for a custom quote.
7. AchieveIt

AchieveIt is a third-party reporting tool built to make NetSuite data more accessible to small and mid-sized businesses. With a simple deployment model and prebuilt templates, it offers quick wins in financial reporting without deep BI or IT involvement.
Benefits of AchieveIt: Quick setup, no-code interface and a focus on usability make it appealing for lean teams.
Features and capabilities of AchieveIt:
- Prebuilt NetSuite dashboard templates
- Budgeting and forecasting modules
- Excel-style interface for easy adoption
AchieveIt is for: Small to mid-sized businesses looking for a quick and easy reporting layer on top of NetSuite.
Best use cases for AchieveIt:
- Cash flow visibility
- Budget variance reporting
- Department-level dashboards
Challenges teams can solve with AchieveIt:
- Speed up monthly reporting
- Simplify executive dashboards
- Reduce spreadsheet sprawl
When not to use AchieveIt: If you're managing multiple subsidiaries or need custom dashboards at scale. AchieveIt offers simplicity – but it has limited customization, and it lacks the scalability needed for multi-entity, high-volume environments.
AchieveIt pricing: Three pricing plans are available upon request. The platform lets you purchase extra modules and add users whenever your business needs more capabilities.
8. OneStream
OneStream is a comprehensive corporate performance management (CPM) platform designed for enterprise-level financial operations. It offers consolidation, close, planning and reporting capabilities under one roof, with support for statutory and regulatory reporting.
While you can integrate OneStream with NetSuite to pull ERP data for reporting alongside other systems, it's not an exclusive reporting tool for NetSuite, which means it may lack some deep customization options.
OneStream benefits: This platform consolidates financial processes across global entities. It’s also customizable to complex business rules and planning requirements.
Standout OneStream features and capabilities:
- Statutory and regulatory compliance reporting
- Consolidation logic for mergers and acquisitions
- Workflow automation and audit traceability
OneStream Software is for: Enterprises with consolidation and financial modeling needs.
Use cases for OneStream:
- Global consolidations across subsidiaries
- Managing statutory and IFRS compliance
- Complex scenario modeling for board presentations
Challenges teams can solve with OneStream:
- Shorten the close process
- Reduce audit risk
When not to use OneStream: If your organization doesn’t require consolidation logic, the cost and complexity may outweigh the benefits.
OneStream pricing: Detailed pricing information is not publicly available.
9. Grow
Grow is a third-party BI platform built for simplicity. It lets you pull in data from NetSuite and other systems to create clean, drag-and-drop dashboards. Designed for fast setup and ease of use, Grow targets non-technical users and small to lower mid-market teams.
For businesses using NetSuite, Grow can work well for high-level KPI dashboards – but may fall short if you need complex financial consolidations or reporting aligned to NetSuite’s chart of accounts and segment structure.
Benefits of Grow: What makes Grow one of the top NetSuite reporting tools is its fast time-to-value for companies that just need a quick snapshot of sales, revenue or operational trends.
Grow features and capabilities:
- Prebuilt data connectors, including NetSuite
- Clean interface for business users
Grow is for: Businesses looking for basic dashboards to track business health without diving into full-scale BI projects.
Use cases for Grow:
- Sales pipeline dashboards
- Marketing performance metrics
- Simple financial visuals for leadership
Challenges teams can solve with Grow:
- Save time on manual reporting
- Make dashboards accessible to non-technical teams
When not to use Grow: Avoid Grow if you require structured data modeling or native handling of NetSuite segment hierarchies, as it may fall short in those areas.
Grow pricing: Full pricing information is only available through the vendor.
10. Striim
Striim is a data streaming platform that connects NetSuite to modern cloud warehouses such as BigQuery, Snowflake and Databricks. It enables continuous data movement using change data capture (CDC), which means updates in NetSuite – like a posted journal or new invoice – can flow into your reporting environment in near real-time.
But Striim doesn’t model NetSuite data or provide out-of-the-box reporting logic. You’ll still need to build out the data model separately, which works well if you already have an analytics engineering function.
Benefits of Striim: By streaming updates as they happen, Striim helps teams build dashboards and alerting systems that reflect the most recent activity.
Features and capabilities of Striim:
- CDC from NetSuite
- Integration with Snowflake, BigQuery and Databricks
- Scalable to large data volumes
Striim is for: Engineering-led teams needing continuous, low-latency data syncs for live analytics.
Use cases for Striim:
- Live operational dashboards
- Real-time insights for supply chain management
- Fraud monitoring
Challenges teams can solve with Striim:
- Build event-driven data architectures
- Integrate NetSuite into modern data stacks
When not to use Striim: If your team needs ready-to-use financial or operational reports – especially those tied directly to NetSuite’s structure – Striim alone won’t get you there. It’s best suited for organizations with a dedicated data team and a modern BI stack already in place.
Striim pricing: This service offers a free option for learning and small projects, a fully managed service starting at $365 per core per month, and self-hosted deployments with custom pricing.
11. WhatAGraph
WhatAGraph is a third-party reporting tool specializing in marketing and agency reporting. It integrates NetSuite data along with digital channels to produce visual, shareable reports.
Benefits of WhatAGraph: Creating visually polished client reports is fast and straightforward, with automated scheduling that helps agencies streamline recurring reporting.
WhatAGraph features and capabilities:
- Prebuilt templates for marketing reports
- Brand personalization
- Automated report delivery
WhatAGraph is for: Small and mid-sized companies or agencies that occasionally need NetSuite data mixed into client-facing reports, especially when marketing data is the main focus.
Use cases for WhatAGraph:
- Marketing reports
- Digital campaign performance dashboards
- Multi-channel analytics
Challenges teams can solve with WhatAGraph:
- Maintain brand consistency
- Automate routine analytics
When not to use WhatAGraph: If your primary reporting needs are financial or operational, WhatAGraph won’t cut it. It’s optimized for surface-level visuals, not ERP depth. NetSuite data isn’t deeply modeled, so anything beyond top-line revenue requires extra configuration or exports. For finance-led reporting, ZoneReporting or Solution 7 are significantly more robust.
WhatAGraph pricing: The platform offers custom pricing based on your team’s reporting needs, use case, and data volume. A free product tour is available on request.
12. Datarails CONNECT
Datarails CONNECT is a third-party FP&A platform that extends Excel with live ERP data connectivity. It targets small- to mid-sized finance teams seeking version control, automation and collaboration while retaining their Excel workflows.
The platform connects with your ERP to bring financial data into Excel, simplifying NetSuite planning and budgeting for finance teams.
Benefits of Datarails CONNECT: While Excel remains the core reporting environment, live NetSuite data adds accuracy and automation.
Features and capabilities of Datarails CONNECT:
- Excel integration with live ERP data connectivity
- Budgeting, forecasting and reporting workflows
- Scenario modeling and driver-based planning
Datarails CONNECT is for: Teams with strong Excel expertise who need a step up in FP&A process maturity – but aren’t ready for a full enterprise CPM tool like Planful or OneStream.
Use cases for Datarails CONNECT:
- Budget consolidations
- Scenario planning
- Monthly board reporting
Challenges teams can solve with Datarails CONNECT:
- Eliminate Excel version sprawl
- Automate actuals imports from NetSuite
When not to use Datarails CONNECT: If you need auditable, traceable reports directly inside NetSuite, Datarails can introduce complexity. It's not a SuiteApp, and reporting happens in Excel, outside the ERP. For teams that want to stay in Excel but keep reporting aligned with NetSuite’s structure, platforms like Solution 7 offer a more ERP-native alternative.
Datarails CONNECT pricing: Customized pricing based on your team size and reporting needs, so you’ll need to request a quote.
Keep reading: Discover 10 NetSuite reports every C-suite executive wants automated
13. JetReports
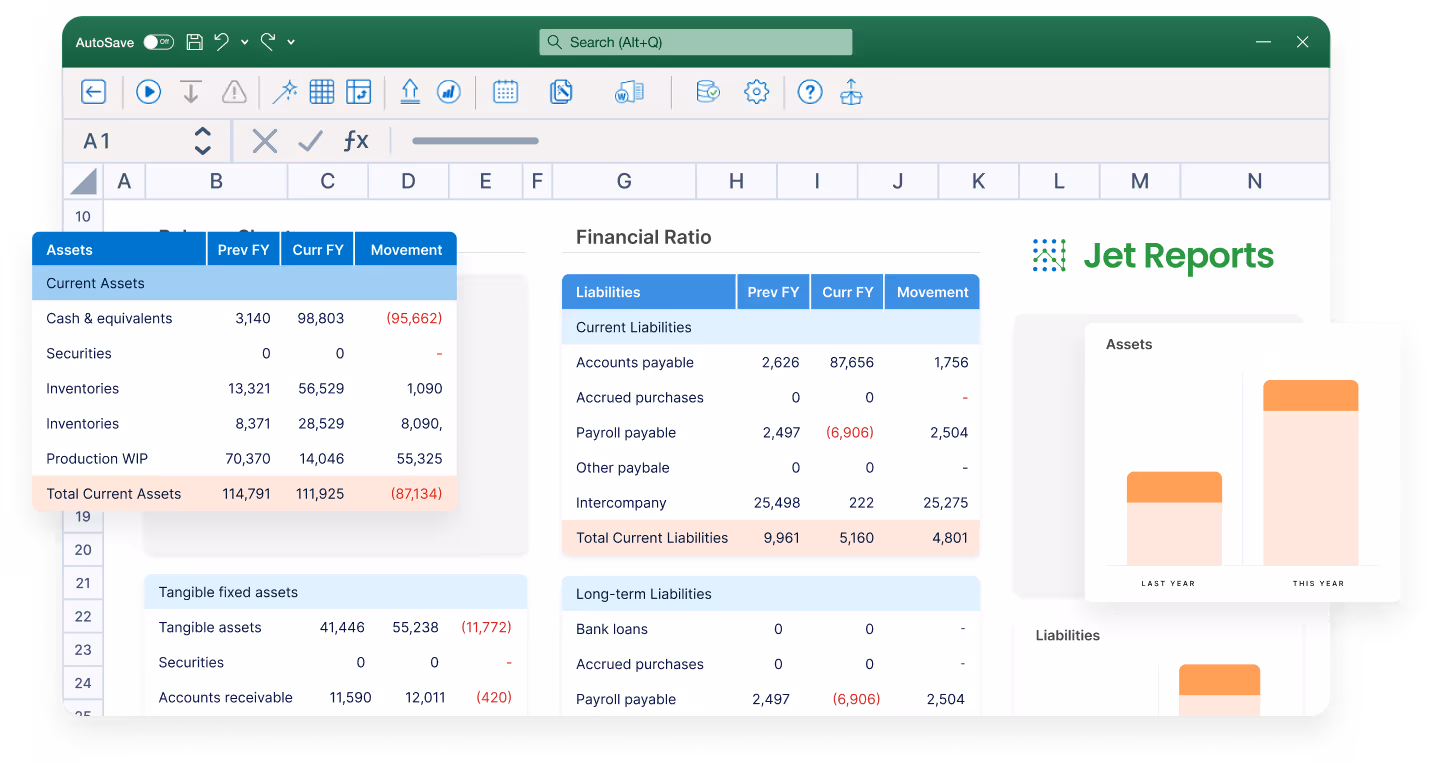
JetReports is an Excel-based reporting tool originally designed for Microsoft Dynamics, now expanded to support NetSuite via data connectors. It enables live reporting within Excel, using drag-and-drop functionality and prebuilt templates.
Benefits of JetReports: Teams work within Excel while accessing live ERP data. The tool offers drill-down insights and a familiar interface.
Features and capabilities of JetReports:
- Drag-and-drop report building
- Prebuilt financial templates
- Multi-currency and consolidation support
JetReports is for: Companies moving from Dynamics to NetSuite who want to stay in Excel and minimize retraining.
Use cases for JetReports:
- Monthly financial statements
- Operational reports with drill-down
Challenges teams can solve with JetReports:
- Reduce manual exports
- Align reports to ERP data
When not to use JetReports: If you're using custom segments, saved search logic or advanced SuiteAnalytics objects, you'll run into limitations with this tool. While JetReports supports NetSuite, it lacks deep NetSuite-native modeling.
JetReports pricing: Available upon request based on company size and deployment needs.
How far can native NetSuite reporting capabilities really take you?
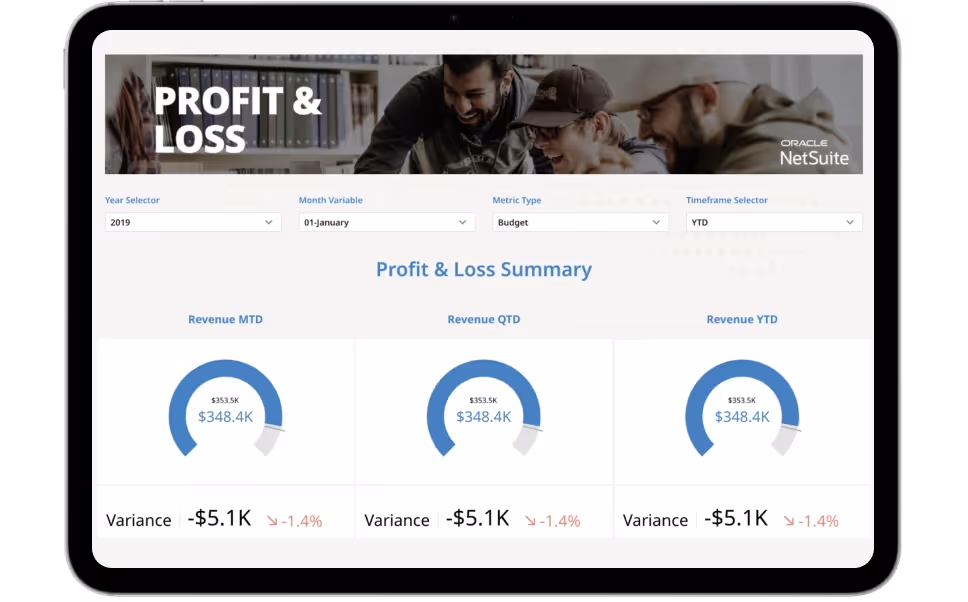
For basic needs like profit and loss (P&L) and AR aging, standard NetSuite's reporting capabilities do the job. But complexity is the breaking point.
- Saved searches let you pull real-time transactional data, filtered and sorted how you want. But they’re hard to scale. Need reports that combine data across departments or value inventory across multiple locations? Anything beyond one dataset often requires exporting data to piece everything together.
- SuiteAnalytics offers visual dashboards and charts. But they don’t connect cleanly to financial reports. You still have to reconcile visuals with general ledger data – and there’s no easy way to trace metrics back to transactions.
- Pre-built financial reports (like balance sheets and P&L) are quick to generate. But customizing them is hard. You’ll hit walls fast – like being unable to group accounts outside your chart of accounts structure or add non-financial data for board-ready output.
Building reports in NetSuite might feel manageable when your operations are simple – single entity, basic chart of accounts, minimal adjustments. But once you're managing multiple entities, currencies or revenue streams, the gaps start to show. Reports slow down. Formatting becomes manual. And critical workflows start living outside the ERP, often in Excel.
That’s where finance teams start looking elsewhere.
Why businesses outgrow NetSuite’s reporting stack
The cloud ERP market is growing fast, but so are expectations. Research from Markets & Markets shows businesses want scalable, cost-effective solutions tailored to their industry, with financial reporting built into a centralized platform.
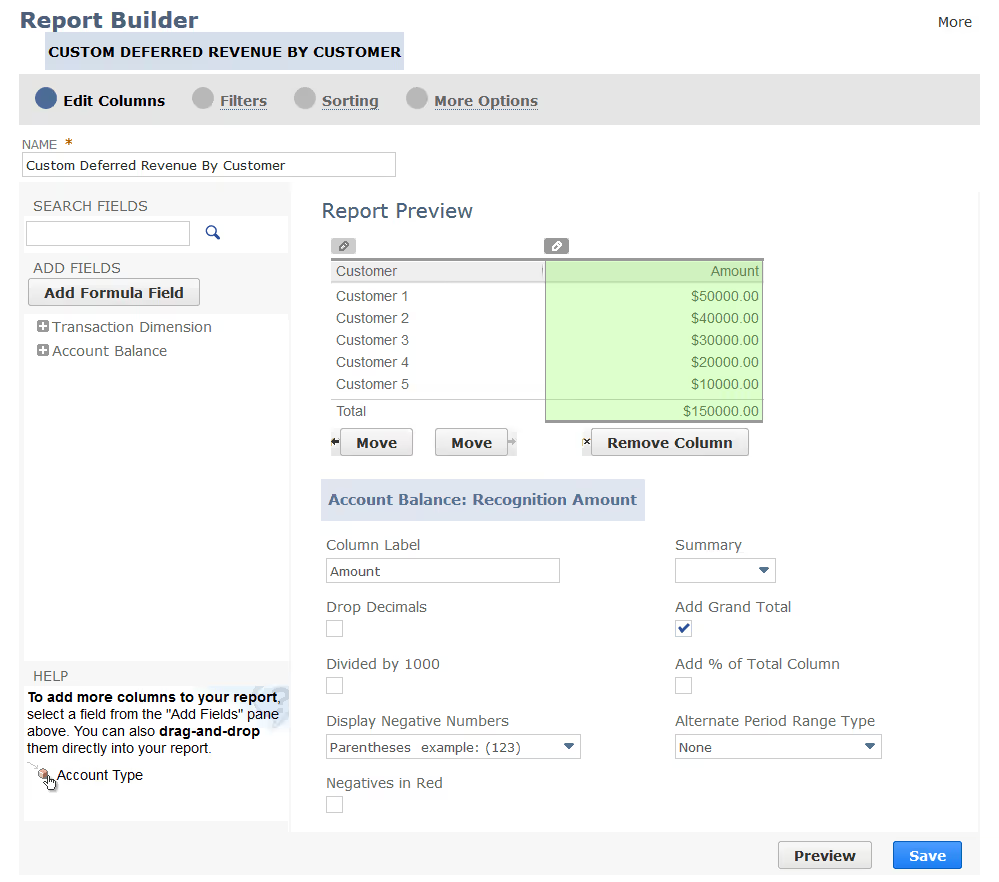
NetSuite Report Builder gives you access to raw financial data – but turning that data into usable, board-ready reporting is a different story. As reporting requirements get more layered (think investor key performance indicators (KPIs) or deferred revenue) teams hit limits in scale and usability.
Let’s look at why NetSuite's reporting capabilities often fall short for growing businesses.
Multi-dimensional reporting requires workarounds
NetSuite’s financial report builder doesn’t support true multi-dimensional slicing within its native features. If you need to compare annual recurring revenue by product line and region across subsidiaries, you’ll need to build and maintain multiple saved searches, stitch them together manually or export to Excel.
Custom views are rigid and hard to maintain
You can’t easily show budget vs actuals with custom groupings, like department rollups that don’t match your chart of accounts. Formatting and layout controls are limited. Many teams resort to Excel just to get reports in a presentable state.
Audit trails and traceability break once you export
Any time you’re manually exporting data to Excel or third-party BI tools like Power BI or Tableau, you’re leaving the ERP’s native audit trail behind. One formula edit, one tab out of sync, and now you can’t validate where a number came from – or prove it during audit.
If you’re already rebuilding reports every month or spending hours validating numbers across systems, that’s not scalable.
Let’s see how alternative NetSuite reporting tools address these limitations while staying connected to your ERP data.
NetSuite-first SuiteApps vs alternative third-party: Which reporting tools for NetSuite actually scale?
Choosing the best reporting tools for NetSuite is all about the right reports, in the right format, for the right decision-makers. Alternative third-party solutions typically fall short in translating NetSuite data structure into clear and trustworthy reports, since they always capture your business and accounting logic – and they don’t hyperlink back to the NetSuite transaction.
However, NetSuite-first SuiteApps like ZoneReporting and Solution 7 are designed specifically for NetSuite’s unique data structure, with support from teams that understand NetSuite. They give you the right report, in the right format, with insights for the right decision makers – and they provide a quick setup and powerful automation that saves time.
See how they compare to third-party tools when it comes to growing with your business.
If your team is tired of exporting, stitching and validating across tools, native NetSuite reporting tools are the better path forward – especially when speed, accuracy and ERP alignment matter more than flashy dashboards.
How do I choose the right reporting tool for NetSuite?
To choose the right reporting tool for NetSuite, start by assessing your business needs and reporting goals. Consider these factors:
- Reporting complexity: Are your reports straightforward or do they require advanced analytics and custom dashboards? If most of your reporting needs fall within finance or operations, native reporting tools for NetSuite may give you everything you need – without overengineering it.
- Data sources: Do you only need NetSuite data or must you combine it with other systems? If NetSuite is your source of truth, a native tool keeps data cleaner and reporting faster.
- User skill level: Will finance teams use Excel-based reports, or do you need interactive BI tools for executives? If your users are already comfortable in Excel or NetSuite, don’t force them into a new user interface. Choose tools that meet them where they already work.
- Integration ease: How smoothly does the tool connect with NetSuite and update data in real time? Native tools win here – they eliminate sync delays, reduce breakpoints and ensure what you see is always live.
- Budget: Balance cost against features and scalability. Many third-party tools look affordable upfront but bring hidden costs – custom connectors, IT support or a hefty fee for initial setup. NetSuite native apps often scale better with less overhead.
- Support and updates: Check vendor reliability and ongoing support options. Prioritize vendors who are NetSuite-first. They’ll move faster when APIs change, and their support teams will speak your ERP language.
Need help narrowing it down? This flowchart walks you through the key questions to match each NetSuite reporting tool to your use case.

Keep reading: Why finance teams are dropping third-party tools in favor of native solutions inside of NetSuite
Must-have features and capabilities to look for in modern NetSuite reporting solutions
If you’re evaluating NetSuite reporting solutions, here’s what to look for – not just to get reports out the door, but to build a reporting foundation that scales with your data, teams and decisions.
- Real-time data, no exports: If your reporting tool relies on batch syncs or delayed refreshes, you risk acting on outdated numbers. Consider tools that pull directly from live NetSuite data, so you can report and act immediately.
- Multi-entity consolidation: A solid reporting tool handles intercompany eliminations, currency conversion and consolidated views – without forcing you into spreadsheets.
- Support for custom fields and records: Most NetSuite environments are heavily customized. Your NetSuite reporting tool must be able to pull in custom fields and records, so your reports reflect how your business actually operates.
- Drill-down capability: Summary metrics are useful, but only if you can trace them back to transaction-level detail without leaving NetSuite.
- Excel-style formatting and logic: Finance teams still rely on Excel to group, format and calculate data the way they want. A good reporting tool brings that same flexibility into NetSuite, so reports stay live and dynamic.
- Role-based access control: Teams should only access the reports or data relevant to their role, with no need to duplicate or rebuild.
- Advanced filtering and calculated fields: Whether you’re building custom logic or tracking non-standard metrics, the NetSuite reporting tool should support filters and formulas (including custom fields) without code.
- Dashboard integration: Users should be able to view key reports directly in their NetSuite dashboards, where they’re always visible and automatically updated.
- Scheduled delivery and automation: You shouldn’t need to pull the same report every week or month. Look for tools that let you schedule reports and automate delivery without manual effort.
Building reports in NetSuite: Best practices for optimizing workflows
If you're building reports in NetSuite, the key isn’t just what you report, but how your team builds, reviews and acts on that data. High-performing teams do three things differently when they create reports in NetSuite:
- Standardize the structure: Create shared definitions for key metrics (like bookings, churn, margin) and apply consistent formulas across reports. Without consistency, you’ll spend more time explaining numbers than acting on them.
- Use AI to uncover what reports might miss: Gartner points out that GenAI works within ERP systems to surface insights and automate actions. Use AI to ask questions in plain language or spot patterns your team might miss.
- Combine reports where context matters: Context saves time and improves decisions. Bundle related reports into one view (for example, project margins next to resource utilization) so users can see how metrics influence each other in real time.
Keep reading: Learn how to elevate reporting and impress your CFO
Simplify reporting in NetSuite with Zone Data Platform
NetSuite reporting tools like Saved Searches and NetSuite Analytics Warehouse are a starting point – but they fall short when external stakeholders need business insights across entities, custom fields and multiple systems, all displayed in their tool of choice.
Zone Data Platform delivers the reports stakeholders actually use to drive decisions – real-time dashboards in NetSuite, dynamic Excel board decks and BI-ready datasets built on trusted NetSuite data. It’s reporting that works the way your business does: fast, accurate and built to scale with you.
Book a demo to explore how Zone can help your team move faster – with NetSuite reporting tools that actually keep up.