

Gain full-service insights from your ERP data with native NetSuite reporting
Deliver auto-updated NetSuite reports to stakeholders with ease. Our Power BI dashboards are based on industry best practices, tailored to your business and fully integrated with NetSuite.
.avif)
Tru cut billing time by 98% with ZoneBilling and ZoneReporting

Analyze all ERP data for deeper insights.
Integrate platforms like Salesforce and HubSpot.
Automate reports and free up hours every week.
For peace of mind, anywhere.
NetSuite business intelligence built for Finance, Operations, Sales and more

Solve data silos
Does your data live in NetSuite, a CRM and all over the place? ZoneReporting brings together all your data sources in clear, always-updated NetSuite Power BI dashboards.

Best-practice NetSuite reports, faster
Considering whether to build your own NetSuite reports or use ours? We spent 3+ years building flawless data visualizations, so you don’t have to. Start quickly with:
- Finance reporting
- SaaS reporting
- Supply chain and inventory reporting
- CRM

Share without expense
Are you struggling to make and share ad hoc reports with stakeholders, the board, or the C-Suite? Provide ERP reports without the cost of ERP licenses. ZoneReporting offers Power BI dashboards that users can easily subscribe to for automatic updates.

Outsource your report updates
No time to update your Power BI standard reports? We can handle all updates, ensuring your reports evolve as your business does. Ask about our convenient ZoneReporting professional services – you’re welcome to outsource your updates to us.
Why leaders trust our NetSuite reporting tools

"ZoneReporting saves users time. It has eliminated the need to build a NetSuite data model from scratch through its pre-built features that are designed to handle the most customized instances. It has reduced the risks of errors in spreadsheets by eliminating manual data updates since this platform automatically refreshes data, thus ensuring reports and dashboards always show the latest financial information."
Verified G2 review
Get a Personalized
Demo Today
Discover how our innovative solutions are tailored to your specific business needs. Streamline your back-office operations, enhance efficiency and drive your business forward.
Advanced NetSuite BI tools for growing companies
ZoneReporting is the only NetSuite- and Microsoft-approved solution that gives you up-to-date, industry-specific BI dashboards, helping you make faster, data-driven decisions.

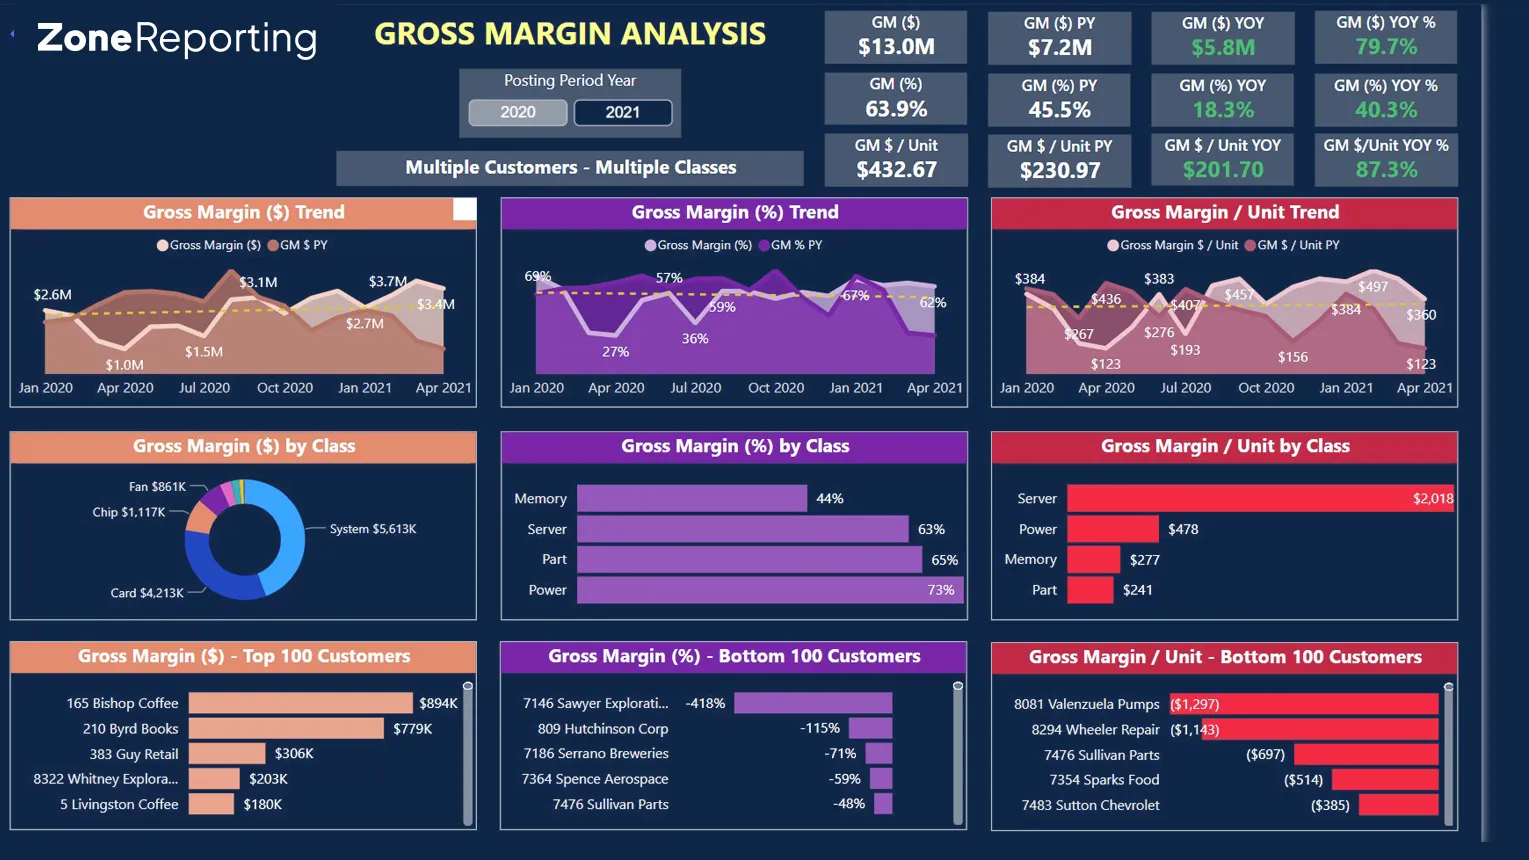
Financial BI reports
Get an overall picture of your financial health. Easily analyze and drill into visual data like top customers, revenue, volume, COGS, profitability, margin, items, subsidiaries and more.
- Watch a quick video
- Or play with our Financial Power BI reports
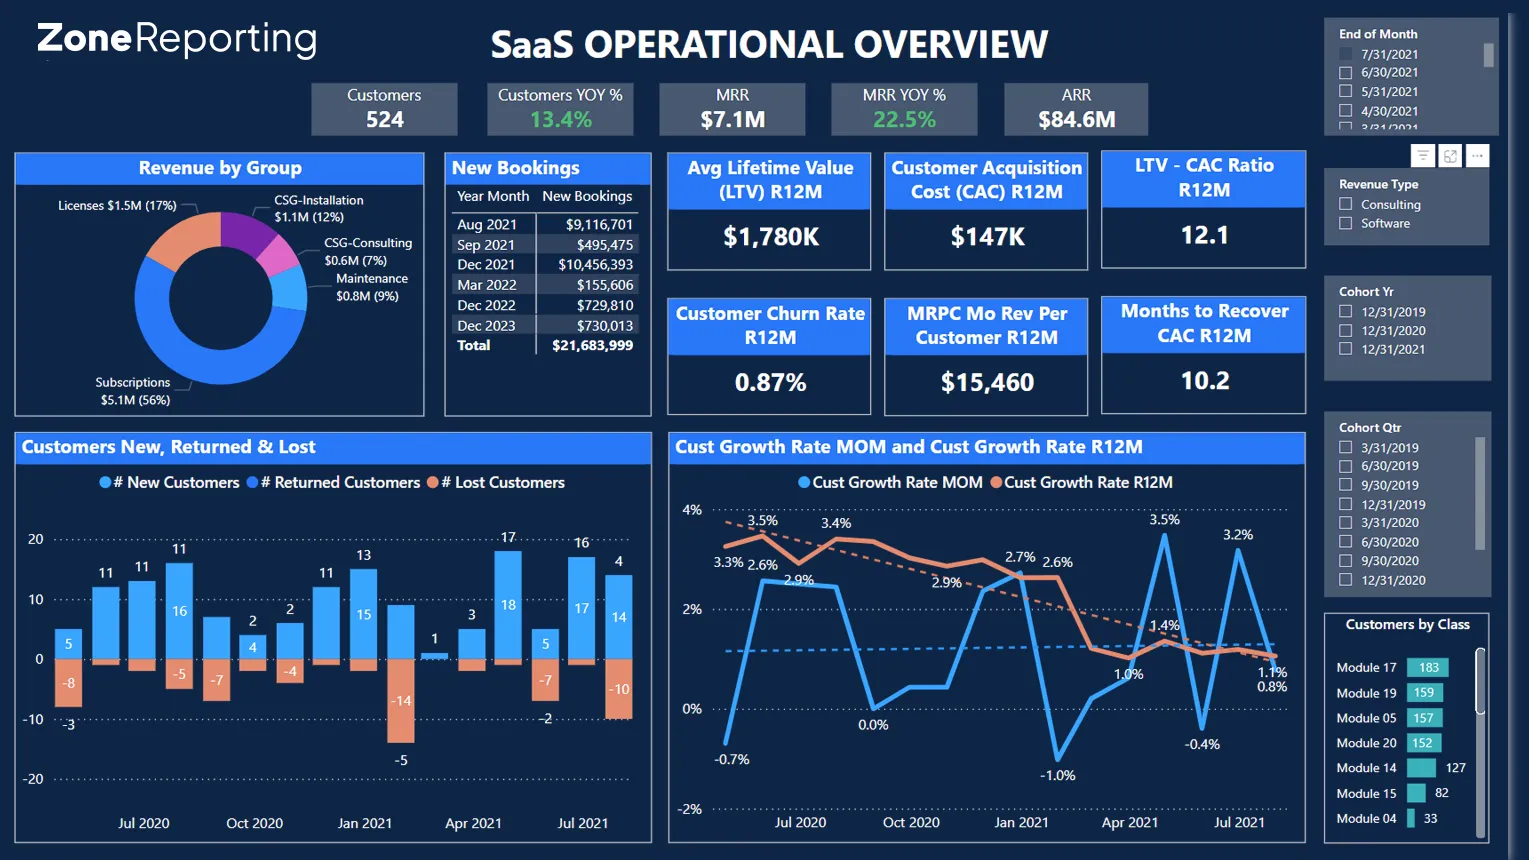
Software and SaaS BI reports
Instantly identify trends that are key to SaaS businesses. By bringing in sources like Salesforce, HubSpot and Google Analytics, we show the whole picture of customer value vs. acquisition cost.
- Watch a quick video
- Or play with our SaaS Power BI reports
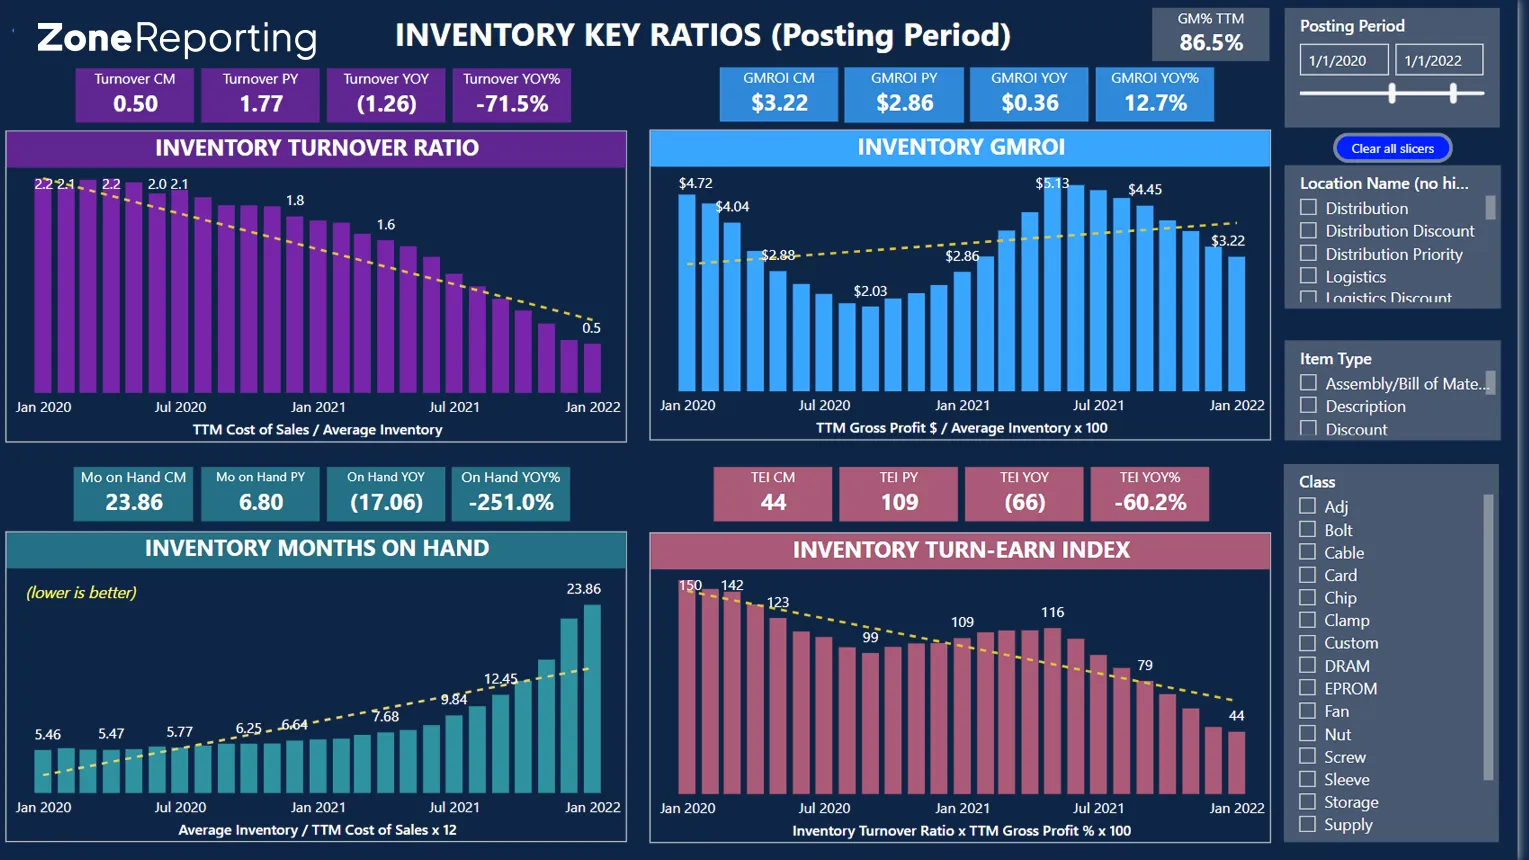
Supply chain & inventory BI reports
When an empty shelf means a missed sale, supply chain reporting is a must. Get an up-to-date view of items, sales orders, purchase orders, work orders – and even product inventory.
- Watch a quick video
- Or play with our Supply Chain Power BI reports
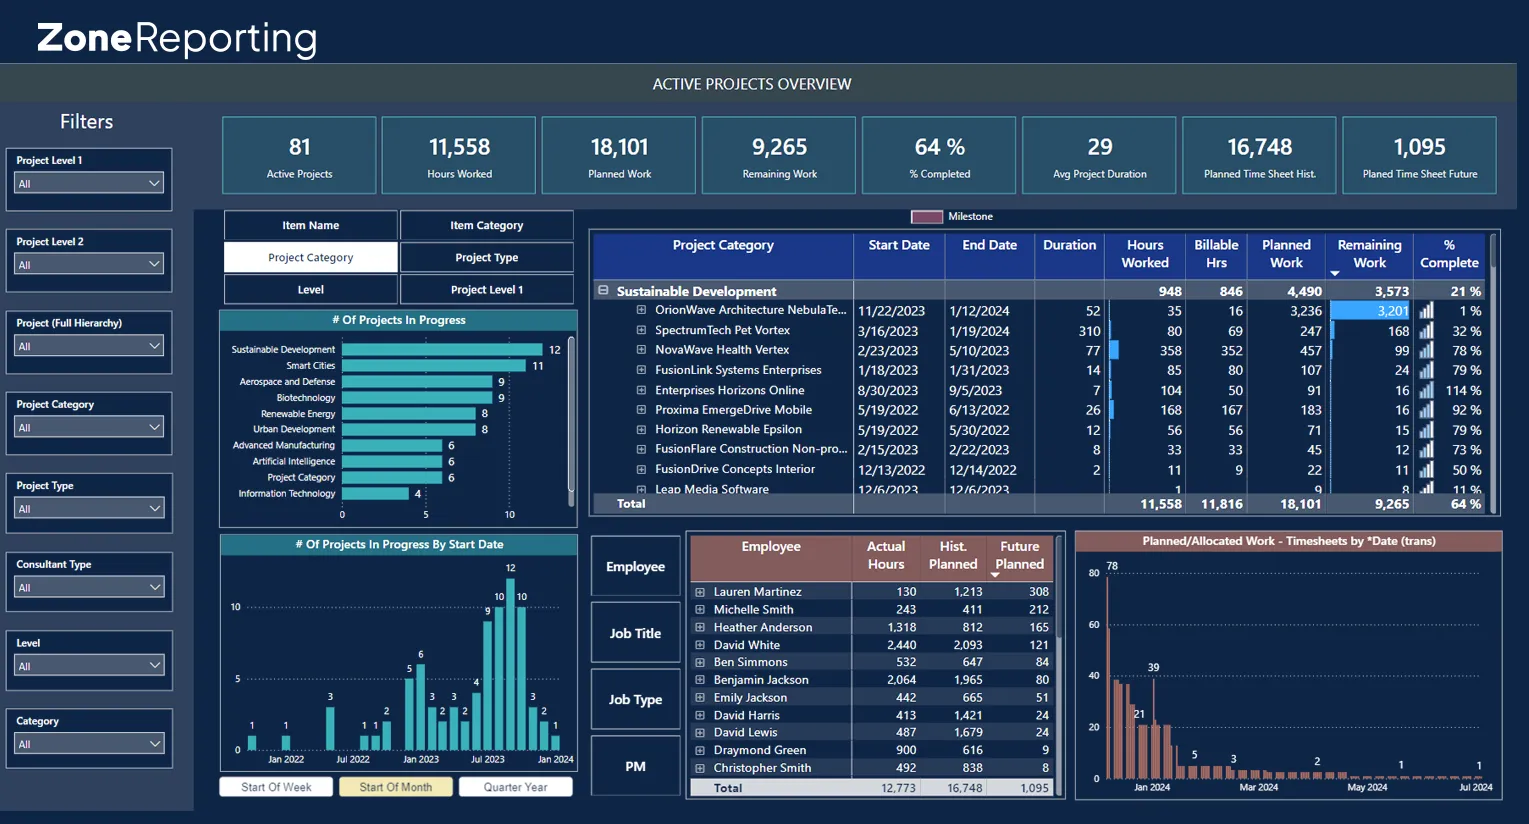
Project & services BI reports
Get insight into SuiteProjects and your full business services funnel. Drill into active and planned projects, look at utilization and resourcing and make smart plans.
- Watch a quick video
- Or play with our SuiteProjects BI reports
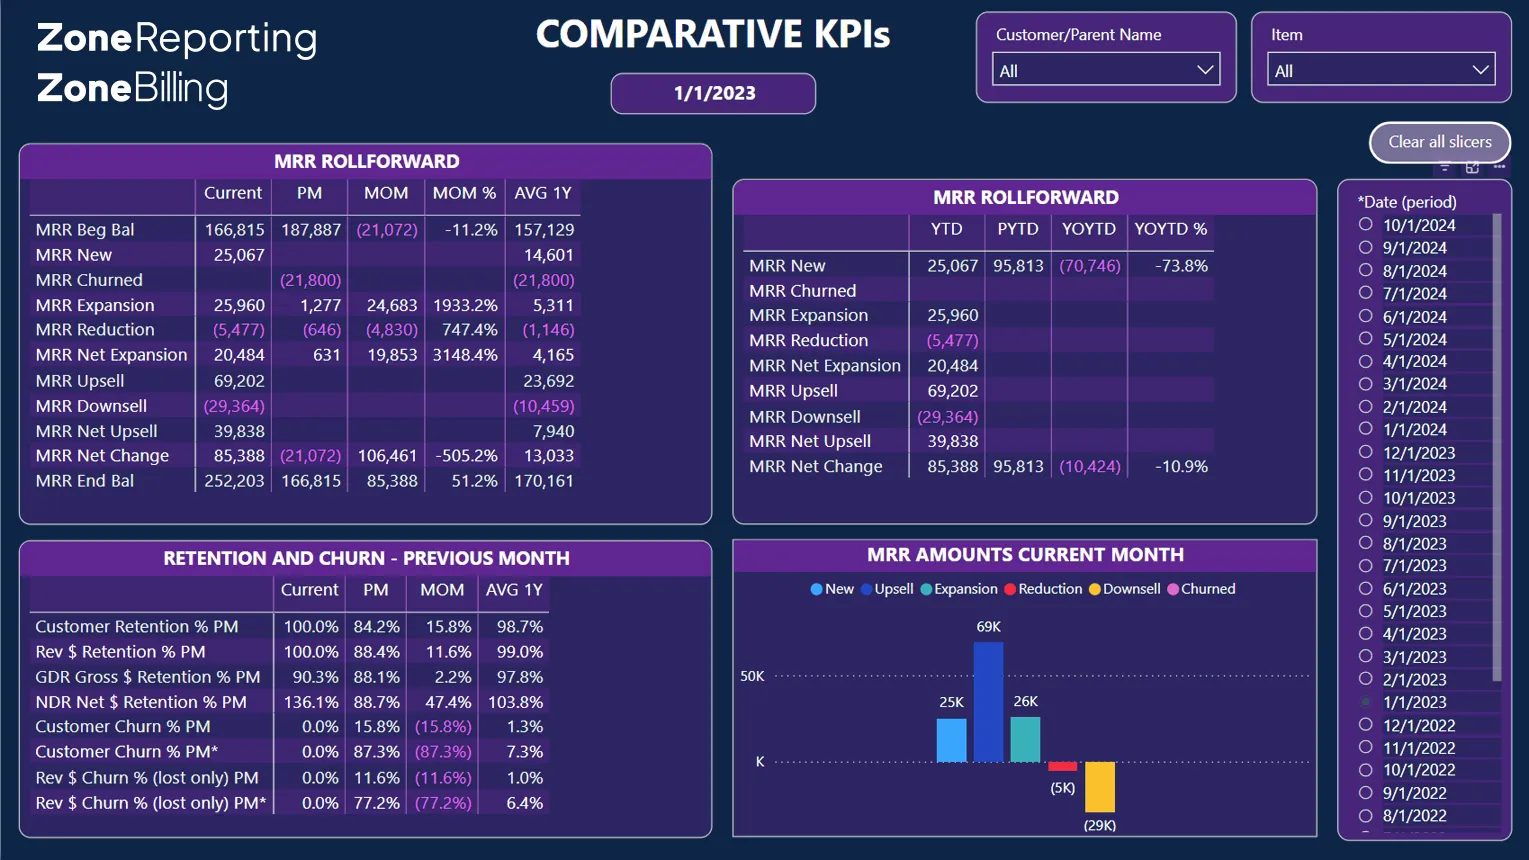
ZoneBilling BI reports
Using ZoneBilling? Gain powerful MRR and ARR rollforward reports so you can see in advance when revenue will drop off. Plus, see charges, upgrades, downgrades and cancellations to take proactive action.
- Watch a quick video
- Or play with our ZoneBilling BI reports
Explore our resources


.png)


.jpg)


.png)


.avif)
.avif)
.avif)
.avif)
.avif)
.avif)


.avif)


Frequently asked questions
What are Power BI reports for NetSuite?
Power BI reports for NetSuite are standard tools for summarizing ERP data like revenue, expenses, customer trends and operational metrics. They include saved searches, summary reports and financial statements, but are often limited by NetSuite’s UI, limited joins and export flexibility.
For more advanced NetSuite financial reporting and operational reporting, finance teams choose tools like ZoneReporting. It simplifies financial reporting by offering always-updated Power BI dashboards that can be fully customized. Users enjoy easier access and unlimited joins so anyone can explore, subscribe to or share, no manual refreshes or ERP licenses required.
What is NetSuite business intelligence?
NetSuite business intelligence is the ability to analyze, visualize and act on NetSuite data across departments. From business KPIs to supply chain performance, BI tools help to display data for ease of decision-making, whether knowing what to purchase or where to cut costs.
ZoneReporting is purpose-built to provide NetSuite BI tools that surface decision-ready insights. Whether it’s project utilization, ARR rollforwards or margin by SKU, dashboards help teams make smarter decisions faster without relying on developers or exports.
How does ZoneReporting enhance NetSuite’s reporting capabilities?
ZoneReporting enhances and extends NetSuite reporting capabilities by providing consolidated reporting and drillable dashboards that can handle the complexities of your business. We bring BI dashboards to where stakeholders are, with automated and visually rich dashboards that are designed for decision-making.
While NetSuite reporting tools are helpful for standard accounting tasks, ZoneReporting provides tailored BI reports that match the way your teams view data – because every business is unique.
ZoneReporting delivers best-practice dashboards through Power BI that are tailored to your team, business model and growth stage, making it one of the most flexible NetSuite reporting tools available.
How long does it take to implement NetSuite financial reporting?
Implementing ZoneReporting for NetSuite financial reporting typically takes 4-8 weeks, compared to the 1-2 years it would take to build a fully-reconciled data model on your own. Additional customizations and data sources, such as Salesforce, Hubspot and Google, will require some additional time to implement.
This additional time is used to set up your ZoneReporting Power BI data model to merge sources and give you clean NetSuite reports, every time, in your preferred view.
How to create a report in NetSuite?
To create a report in NetSuite, follow these steps:
- Navigate to Reports > New Report
- Choose your record type
- Define filters, columns and formatting
You can also build reports in NetSuite by using saved searches to pull data, but saved searches do not provide visualizations. A third solution is SuiteAnalytics, which offers some visualizations, but has limits on what data you can combine and display.
Most teams outgrow the standard NetSuite financial report builder and that’s where ZoneReporting comes in. It extends NetSuite with unlimited joins and Power BI capabilities, and we can even show you how to embed a report in NetSuite using ZoneReporting. ZoneReporting goes beyond NetSuite to provide intuitive, always-current dashboards your executives will actually use.
How to customize a report in NetSuite?
To customize a report in NetSuite, you can edit the report layout, add filters, adjust groupings and modify fields but these changes often require scripting or workarounds for more advanced logic.
ZoneReporting helps overcome challenges in NetSuite with a visual interface built on Power BI. It removes the limitations of the financial report builder in NetSuite with a Power BI data model that is 100% reconciled to your NetSuite account. This allows you to report on all your custom fields and records, plus non-NetSuite data – so your stakeholders can view the tailored metrics, KPIs, and insights that matter most.
Do stakeholders need a Power BI license to view ZoneReporting reports?
If you choose to export your ZoneReporting Power BI reports and then share them with stakeholders, they do not need a Power BI license.
If you choose to share the interactive, up-to-date ZoneReporting dashboards with stakeholders, each of them will need a Power BI Pro license. These licenses are approximately 90% more cost-effective than a NetSuite license.
Keep reading: How to use Power BI in NetSuite
What data sources can I combine with NetSuite data in ZoneReporting BI dashboards?
ZoneReporting is built on Power BI, which enables you to bring in any of hundreds of financial and operational data sources. Power BI includes over 350+ connectors. Most customers choose to connect with Google Analytics, Salesforce and/or HubSpot.
Can I use AI or GenAI with ZoneReporting?
Yes. ZoneReporting is built on Power BI, which is Microsoft’s industry-leading business intelligence tool. This tool includes GenAI and Intelligent AI features, so you can query your reports and gain additional insights.
Is ZoneReporting available for Microsoft Power BI?
Yes, ZoneReporting real-time reports and dashboards are available exclusively on Microsoft Power BI.
This gives the user benefits such as:
- The #1 NetSuite BI tool that is commonly used
- Best-in-class data visualizations, charts, and graphs
- User-friendly interface with customizable views
- Financial reporting capabilities tailored for NetSuite data
- Inexpensive licenses to see, subscribe to, and/or drill into reports
- Easy sharing and alerts by subscribing to updates
- Easy exporting to other tools like PowerPoint and Excel
Additionally, you can embed the BI dashboards back into your NetSuite portlets.
What professional services are available to manage or customize reports?
Customers can choose between modifying their own financial reports in NetSuite, or having Zone Professional Services handle report updates and customizations on their behalf. Our professional services are available as recurring subscriptions so you always know that services will be on time and within budget. Alternatively, you can also choose one-time professional services.