
A private equity sponsor emails at 4 p.m. on a Thursday asking for the rolling 13-week cash flow forecast by end of day Friday. Or a lender calls asking for the current week’s cash position as part of a covenant compliance check.
For many mid-market finance teams fulfilling these requests is a scramble because pulling the inputs – accounts receivable (AR) aging by expected collection week, open accounts payable (AP) by due date, payroll schedule, bank balances across multiple accounts – takes half a day of manual work even when the data lives in NetSuite.
Cash flow forecasting at the 13-week level is a discipline, not a spreadsheet. This article covers how to structure the model, what inputs it requires, where teams consistently go wrong and how to automate the weekly update process inside NetSuite so the forecast is always current without the manual assembly work.
Key highlights:
- A 13-week cash flow forecast covers a rolling 91-day window, updated weekly with actual versus forecast variance analysis.
- The forecast includes cash receipts, cash disbursements and net cash position.
- The biggest challenge is assembling the weekly inputs from accounts payable (AP), accounts receivable (AR), payroll and bank data without manual effort
- NetSuite teams can automate cash flow reporting and reduce the weekly update from hours to minutes with ZoneReconcile and ZoneLiquidity.
What is a 13-week cash flow forecast?
A 13-week cash flow forecast is a short-term liquidity model that projects expected cash inflows and outflows over the next 13 weeks. Unlike monthly or annual forecasts, it’s updated weekly with actual data and includes variance analysis against the prior week’s projections.
The model is built using the direct method of tracking actual cash movements rather than starting from net income. This makes it more operationally accurate than the indirect forecasting method used in strategic planning, and it’s why lenders and PE sponsors specifically require it. A monthly cash flow statement tells you how the period performed. A 13-week rolling forecast tells you what’s coming in the next 91 days and flags any week where the position could become tight.
The format is the industry standard for PE-backed companies, businesses managing debt covenants with cash-related triggers and any company preparing for a capital raise or refinancing. It’s also used by CFOs who simply need better short-term cash visibility than a monthly close provides
13-week forecast vs. monthly cash flow forecast
While organizations often maintain both models for different purposes, the 13-week forecast and monthly forecast serve distinct operational and strategic needs. The following comparison highlights the key structural and functional differences between the two approaches.
Most organizations that use a 13-week forecast also maintain a longer-term monthly model. They serve different purposes and the inputs are different – don’t try to collapse both into one model.
How to structure a 13-week cash flow forecast
The cash flow forecast template has three sections: cash receipts, cash disbursements and net cash position. Here’s how to build each one.
1. Cash receipts
Expected cash inflows are recorded by week in the cash receipts section. This includes the following line items:
- Accounts receivable collections: Organize these by the week you expect to receive payment, rather than the invoice date. Using your AR aging report (categorized into current, 30–60, and 60–90 days), apply historical collection patterns to project timing. For instance, if customers usually settle in 30 days, current invoices likely convert in weeks 1–2, while those in the 30–60 day bucket may collect in weeks 3–5.
- Anticipated bookings and billings: Include new business expected to close within the forecast window, applying realistic timing for actual collection based on your pipeline.
- Deferred revenue releases: Account for items like prepaid contracts or SaaS renewals that will trigger cash inflows.
- Miscellaneous inflows: Include tax refunds, interest income, proceeds from asset sales or intercompany receipts.
Because the AR aging report is your foundational input, its accuracy is paramount. Stale or incorrectly dated records in NetSuite will result in a flawed receipts forecast.
2. Cash disbursements
The cash disbursements section tracks all anticipated weekly outflows. Key components include:
- AP payments: Use your open AP aging report as the primary source. Categorize payments by due date while adjusting for actual behavior, such as whether your firm typically pays on the exact due date or follows a specific batch schedule.
- Payroll: Use exact calendar dates from your payroll schedule rather than monthly averages. Timing is critical, especially for bi-weekly cycles where pay dates shift each month.
- Fixed obligations: Include recurring costs like insurance premiums and equipment or office leases.
- Debt service: Map out principal and interest payments based on your exact amortization schedule.
- Capital expenditures (Capex): Account for any upcoming contractor payments or planned asset purchases.
The AR aging report is the primary input. Accuracy depends directly on AR data quality inside NetSuite, so stale or incorrectly dated receivables will produce a misleading receipts forecast.
3. Net cash position and variance analysis
The calculation is:
Each week’s ending balance becomes the next week’s beginning balance, rolling forward through all 13 weeks.
The addition that makes the model useful over time is the variance tracking column. Each week, record the actual receipts and disbursements alongside the forecast figures. The variance tells you where your assumptions are consistently off – and consistently off assumptions in the same direction are more useful than random noise. If collections are running 15% below forecast every week, that’s a model assumption problem, not a random event.
Inputs you need to build the forecast
The following data sources are required each week to update the model:
- Current AR aging report, segmented by expected collection week (not invoice date)
- Open AP aging report, segmented by payment due date
- Payroll schedule with exact payment dates for the next 13 weeks
- Bank balance as of the forecast start date, confirmed against actual bank statements
- Debt service schedule – interest and principal payment dates
- Recurring fixed obligations with monthly and annual amounts and payment dates
- Any known one-time items like planned capex, upcoming tax payments or M&A-related disbursements
The first three come directly from NetSuite. Bank balances typically require logging into one or more bank portals unless you have a direct bank feed integration. This is where the weekly update time accumulates for most teams – not the model math, but the data assembly.
Common mistakes in 13-week cash flow forecasting
The following are the most common errors that undermine forecast accuracy:
- Using invoice date instead of expected collection date for AR. Invoices issued on March 1st on net-30 terms won’t collect until late March or early April. Mapping everything to invoice date systematically understates how far out receipts actually land.
- Assuming AP is paid exactly on the due date. Most companies run a payment batch weekly or bi-weekly, which means some invoices are paid a few days early and some a few days late. Use your actual payment behavior, not the contractual due date.
- Missing payroll timing. Bi-weekly payroll falls on different calendar dates each month. In some months, two payroll runs hit within a three-week window. This creates predictable cash outflow spikes that are easy to model accurately and disastrous to miss.
- Not updating weekly with actuals. A 13-week forecast that isn’t updated becomes useless within two weeks. The discipline of weekly actuals entry – even when the numbers are close to forecast – is what builds the model’s forecasting accuracy over time and keeps stakeholders trusting it.
- Treating deferred revenue as cash. Deferred revenue is a liability, not a cash position. If your company collects upfront for annual SaaS subscriptions, the cash came in at signing, not ratably. Map cash to when it was actually received.
- Forgetting one-time items until the week they hit. Tax payments, insurance renewals, capex invoices and professional fee payments are often missed in the model because they don’t show up in the recurring AP aging until they’re already due. Build a calendar of known one-time items and incorporate them at the start of each quarter.
Building and automating your 13-week cash flow forecast in NetSuite
Most teams start with a spreadsheet and manual data pulls. That works at low frequency and low complexity, but it creates a recurring time cost that grows with the business. Here’s how to automate the process using NetSuite cash flow tools:
- Set up NetSuite saved searches for AR aging segmented by expected collection week. Build the search around the due date field, not the transaction date, and group by week.
- Pull open AP aging by payment due date using a saved search that shows outstanding bills by the week they’re scheduled to be paid. Filter by vendor payment terms to account for early or late payment patterns.
- Connect payroll data. If you’re running payroll through NetSuite with ZonePayroll, the payroll schedule is already in the system. If not, maintain a manual calendar of payroll dates as a supplementary input.
- Pull bank balance feeds. Instead of logging into multiple bank portals to pull opening balances each Monday, ZoneLiquidity and ZoneReconcile aggregate real-time bank balances inside NetSuite – so the starting position is always current without manual data entry.
- Automate the weekly data refresh. Build a cash flow report that pulls the AR aging, AP aging and bank position data automatically. Add the payroll and one-time items as inputs to the same dashboard.
- Add variance tracking. Configure the dashboard to show actual versus forecast by week and flag weeks where variance exceeds a defined threshold. This turns the forecast from a static model into a live management tool.
What automated 13-week cash flow forecasting improves for finance teams
When AR aging, AP aging and bank balances feed directly into the forecast from NetSuite, the weekly update shifts from data assembly to data review. The same finance team that spent two hours pulling inputs now spends twenty minutes checking variance explanations and updating any forward-looking assumptions that have changed since last week.
The practical differences compound over a quarter:
- Variance tracking becomes reliable. When inputs are pulled manually at different times each week, variance analysis picks up noise from the data pull as much as it does from actual forecast error. Automated inputs mean variance reflects model accuracy, not timing differences.
- Stakeholder requests stop being emergencies. A PE sponsor or lender asking for the current week’s cash position gets an answer pulled from a live dashboard, not a Friday afternoon rebuild from scratch.
- The model improves faster. Consistent inputs mean consistent variance data, which means the feedback loop between forecast and actuals tightens. A model maintained with automated inputs for six months is materially more accurate than one rebuilt manually each week.
- One-time items are harder to miss. When the forecast runs from a live dashboard connected to NetSuite AP, upcoming payments surface in the model as they’re entered, rather than appearing only when they hit the AP aging the week they’re due.
The ceiling on manual forecasting isn’t the model design. It’s the input reliability. Automation removes that ceiling.

Zone’s treasury platform adds to NetSuite cash management
For teams that need real-time bank visibility inside NetSuite, Zone and ZoneReconcile eliminates the manual bank portal logins that typically consume Monday mornings:
- Real-time bank balance aggregation across all accounts, inside NetSuite
- Cash position by entity for multi-entity businesses
- Automated bank reconciliation that keeps the GL cash balance current
- Payment scheduling with direct cash flow impact visibility
- Configurable alerts for low balance thresholds
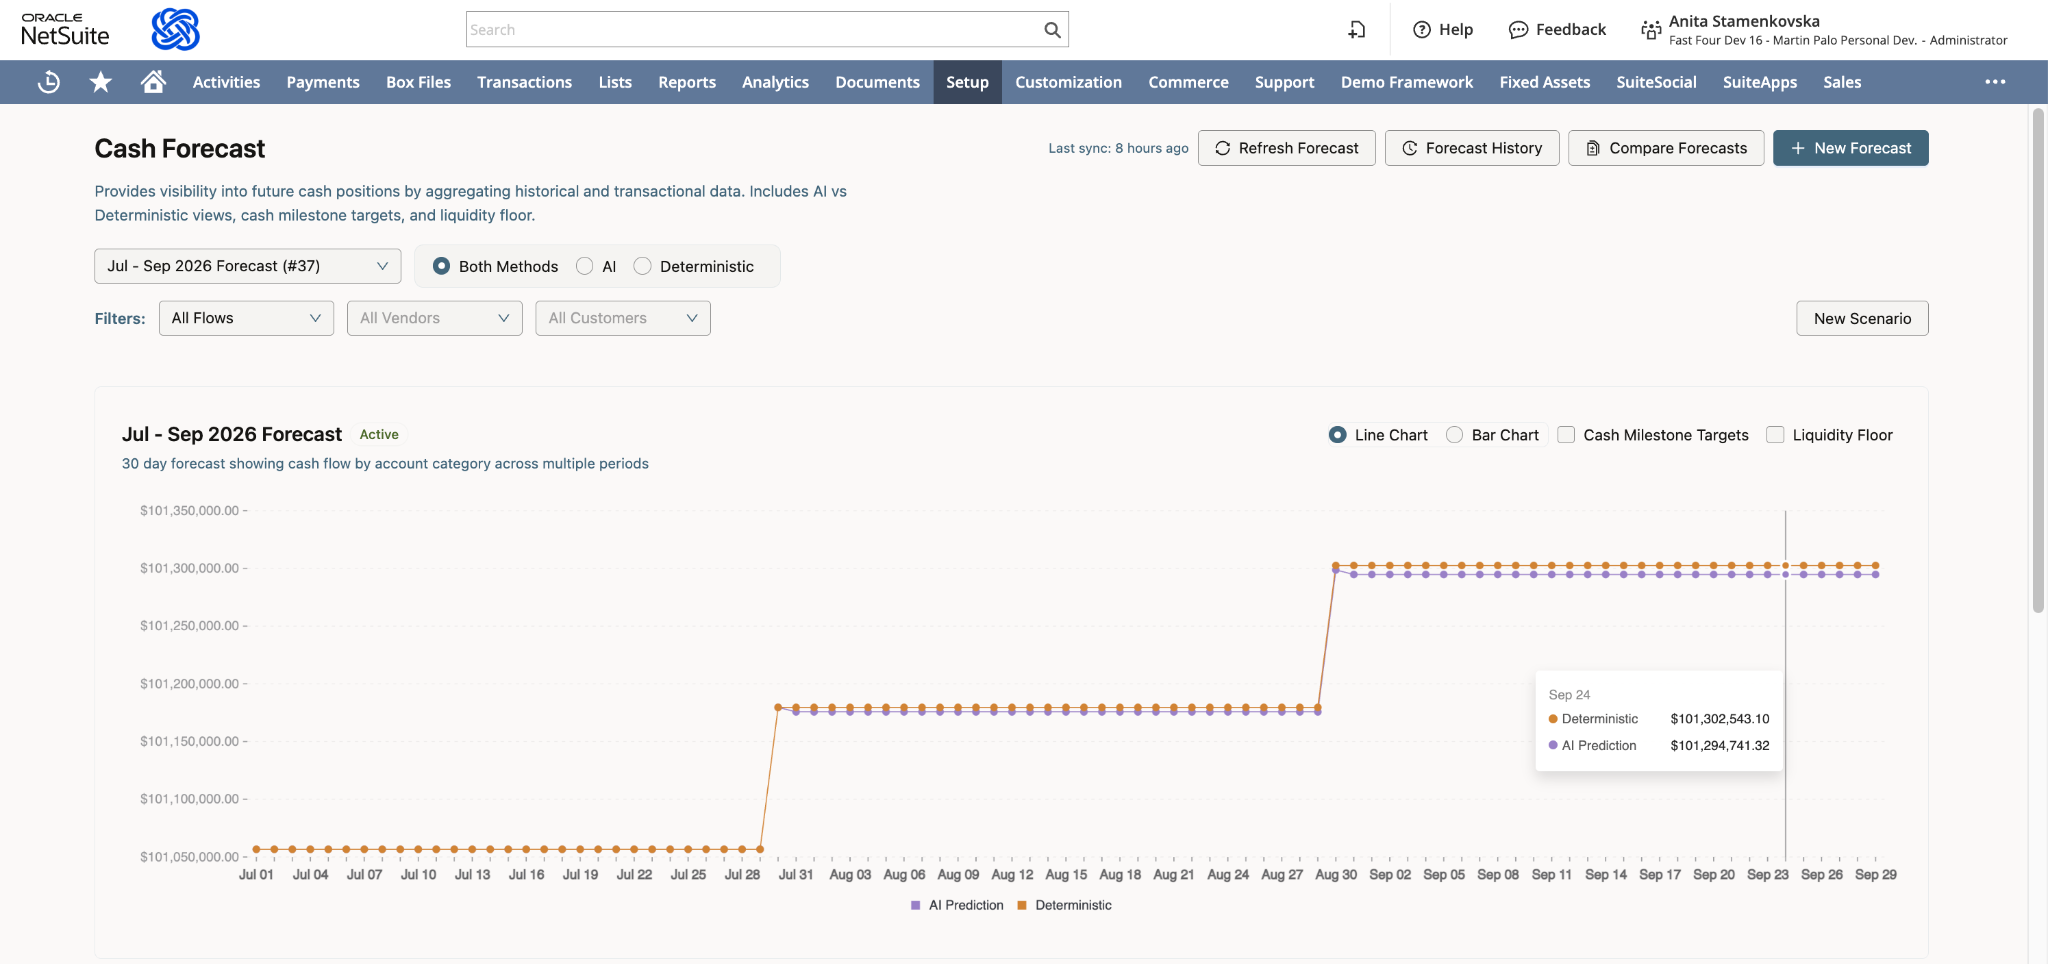
ZoneLiquidity and its Scenario Planning Agent with Zoe by Zone adds the forecasting layer:
- Pre-built cash flow report templates configurable for 13-week format
- Customizable weekly cash position dashboards
- Actual vs. forecast variance tracking
- Drill-down to underlying transaction detail for any line item
- Scenario planning to model impacts before making decision
Together, they reduce the weekly forecast update from a multi-hour data assembly exercise to a review of the automated output – checking variance explanations and updating any forward-looking assumptions that have changed.
Book a demo to see ZoneReconcile in action and join ZoneLiquidity’s waitlist.